RMM Alerting
This article contains the following information:
- RMM Alerts
- RMM Alert Profiles
- Create a new RMM Alert Profile
- Edit RMM Alert Profile
- Delete RMM Alert Profile
RMM Alerts
RMM service features a range of alerts to notify providers and/or administrators on events in network infrastructure (servers and workstations) with the installed RMM Agent instances. The following alerts are available to configure in Management Console.
- CPU Usage > 90% for 5 minutes
- Memory Usage > 90% for 5 minutes
- Used Disk Space > 90%
- Windows Update Not Found or Not Running *
- Antivirus Issues *
- Incorrect System Time
- CPU Temperature > 90°C (176°F) for 5 minutes
- S.M.A.R.T issues
- Connection Loss
- Software Changes
- Hardware Changes *
- Service State
- SNMP Devices
Alerts marked by * are available only for computers running Windows
Note that some alerts (for example, threat detection in Antivirus Issues or Server is offline for 20 minutes) are supported only in RMM Agent version 1.2 or later
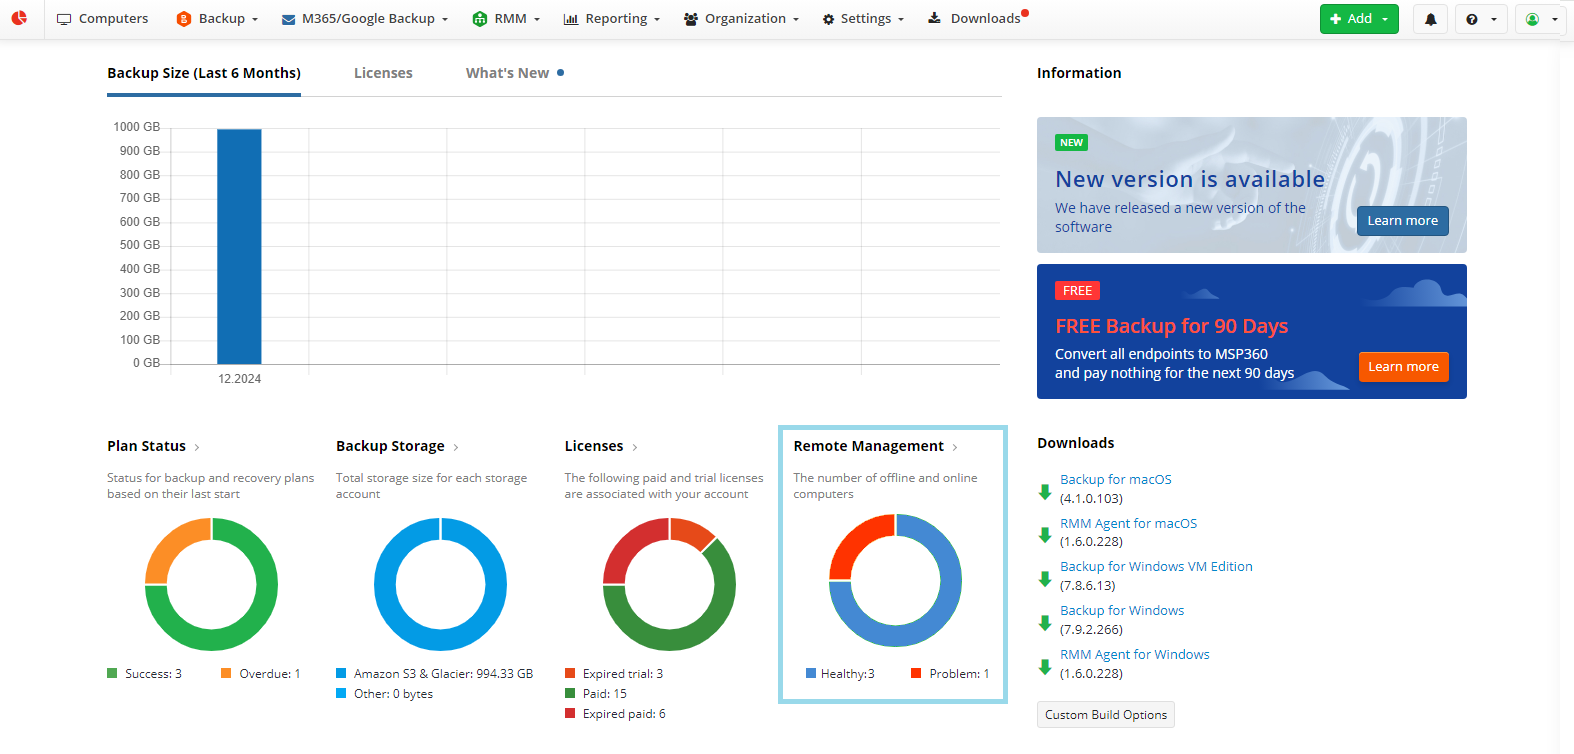
A summary of monitored computers is displayed on the Remote Management widget on the Home (dashboard) page.
Depending on the severity of a reported event, the following states of computers with the installed RMM Agent instances are available:
- Healthy. This state displays that the computer is online and no monitored problems or warnings are found
- Warning. This state displays the detection of warnings related to one or more of the selected alert types
- Problem. This state means that a problem or failure related to one or more of the selected alert types is found
- Offline. This state means that a computer is not available for Remote Management. The computer can be turned off or an RMM Agent version is not installed on it.
Alert threshold can now be customized as described below. The following thresholds are used as default triggers to create and then report an event:
| Alert Type | Healthy | Warning | Problem |
|---|---|---|---|
| CPU Usage | CPU usage for 5 minutes < 70% | CPU usage for 5 minutes > 70% | CPU usage for 5 minutes > 90% |
| Memory Usage | Memory usage for 5 minutes < 70% | Memory usage for 5 minutes > 70% | Memory usage for 5 minutes> 90% |
| Used Disk Space | Used Disk Space < 70% | Used Disk Space > 70% (any of disks) | Used Disk Space > 90% (any of disks) |
| Antivirus (applies to Windows Defender only) | Antivirus is running | * Antivirus automatic updates are turned off * Antivirus out-of-date * Antivirus is disabled * Only Windows Defender found (basic protection) |
Antivirus not found or not running |
| Update | The latest Windows update is installed | Available Windows updates found | Windows Update not found or not running |
| System Time | - | - | System Time differs from the time on the server by more than 5 minutes |
| S.M.A.R.T. | - | - | One or more S.M.A.R.T. attributes are critical |
| Server Is Offline | - | - | 20 minutes |
| Software Change | - | Alerts arrive only from software installed for all users on a computer | - |
| Hardware Change | - | Hardware change is reported (some devices are excluded by default) | - |
| CPU Temperature | - | - | 80°C (176°F) for 5 minutes |
Refer to Alert Generating Logic below for details on how the event is created and processed.
Alert Generating Logic
In the RMM Agent, current information is compared with the information received in the previous 10-minute period.
Alerts are generated only if the new state changes to Problem.
Alerts are not generated if:
- No previous states are in the database, so a comparison is impossible
- Current state is not changed compared to a previous one
A separate alert is generated for any event type and sent to RMM Service. RMM Service handles the alerts received from RMM Agents and sends email notifications according to the global, company or computer notification options.
Healthy, Problem, Warning, and Offline states are reported on the Home (dashboard) page of the Management Console
Triggered alerts appear on the RMM > Computers page in the RMM column as Events.

Events can be filtered by a company and by alert severity:
- Warning. Displays all computers with warnings
- Problem. Displays all computers with problems and failures
- All. Clears filters
Generated alerts can be monitored on the RMM Alert History page. If there are no generated alerts, this table will be empty.

RMM Alert Profiles
As of Management Console version 7.7, the RMM alert profiles are introduced as RMM Alert handling policies for all companies (global level), selected companies (company level) and selected computers (computer level).
Highlights:
- RMM Alert Profile levels
- RMM Alert Profiles are now available at global, company, and computer levels with tag-based filtering supported at global and company levels. The latest computer-level RMM alert profile has the highest priority. Refer to Resolve conflicts for details
- Automatic Conversion of Existing Settings
- Default RMM notification settings are converted into a Global RMM alert profile.
- Customized RMM notification settings are converted into individual RMM alert profiles.
- Centralized Management
- Unified control of RMM alert profiles for better organization and accessibility.
- Post-Actions for Alerts. Post-actions supported for all or specific alerts, including:
- Email notifications
- Push notifications
- Environment-based scripts
- Ticket creation (if applicable).
- Conflict Resolution
- Only one active profile with the highest priority is applied to a specific managed computer.
- Conflicts can be reported if some profiles overlap. Refer to the Resolve conflicts chapter for details
A summary of RMM alert profiles is displayed on the RMM Alert Profiles page.

Create a New RMM Alert Profile
To create a new RMM alert profile, start the Set RMM alert profile wizard.
- Open Management Console
- On RMM > Alert profiles, click + to create a new RMM Alert Profile.
- The Set RMM alert profile wizard appears.
RMM alert profile wizard steps
- On the Profile settings step, change the default profile name, if needed.
- Configure the RMM alert profile scope. Select one of the available options:
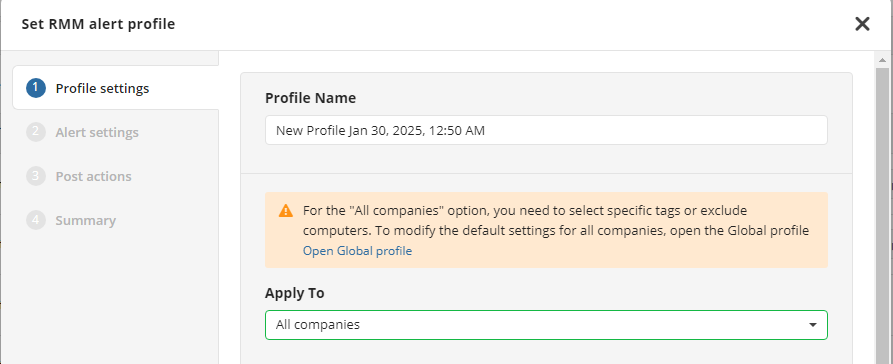
- All companies. Select this option to create a global RMM alert profile. If you already have the global profile, you can select this option to create a global profile + tags, as described below. It is recommended to have the global profile to use it as a default for newly added computers or companies. To create the global profile and the global profile + tags, the ALL Companies permission is required for the administrative account.
- Computers in selected companies. Select this option to create a company-level RMM alert profile. You can select this option to create a company-level profile + tags, as described below. To create the company-level profile and the company-level profile + tags, the permission to manage the selected companies is required for the administrative account.
- Selected computers only. Select this option to create the computer-level RMM alert profile. Refer to the Resolve Conflicts article to realize what profile will precede.
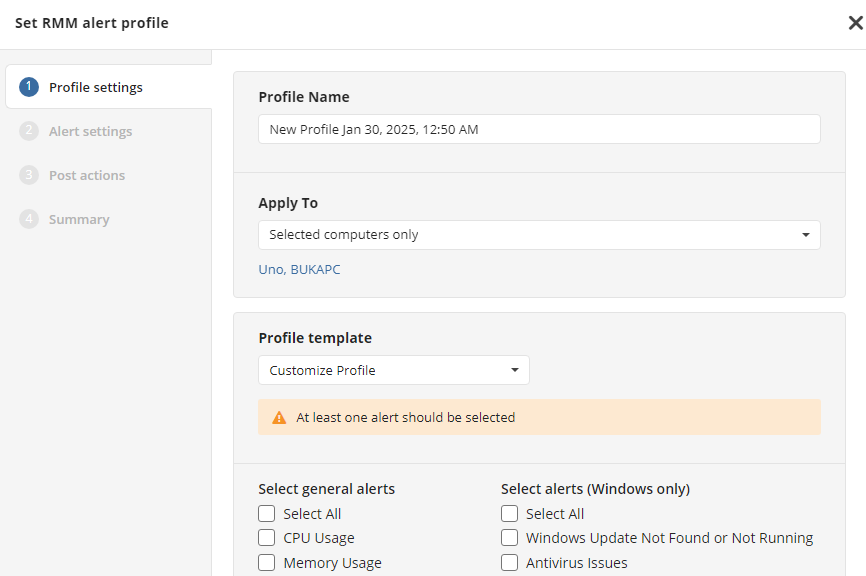
- To create a global profile + tags, select any of the following options:
- Select All companies and then turn on Filter by tags. Select one or more tags, then save your selection. Now only the computers with any of the specified tags will be included in the RMM alert profile scope.
- Select All companies and then turn on Exclude computers.... Select one or more computers to exclude, then save your selection. Now selected computers will be excluded from the RMM alert profile scope.
- Use both options, if needed.
- If on this step some profile conflicts are detected, refer to the Resolve Conflicts chapter for details.
- To select the RMM alerts added to profile, select one of the available options for Profile template.
- Inherit from Global Profile
- Inherit from Company Profile, then select a profile
- Inherit from Computer Profile, then select a profile
- Customize Profile. This option allows you to create a profile from scratch.
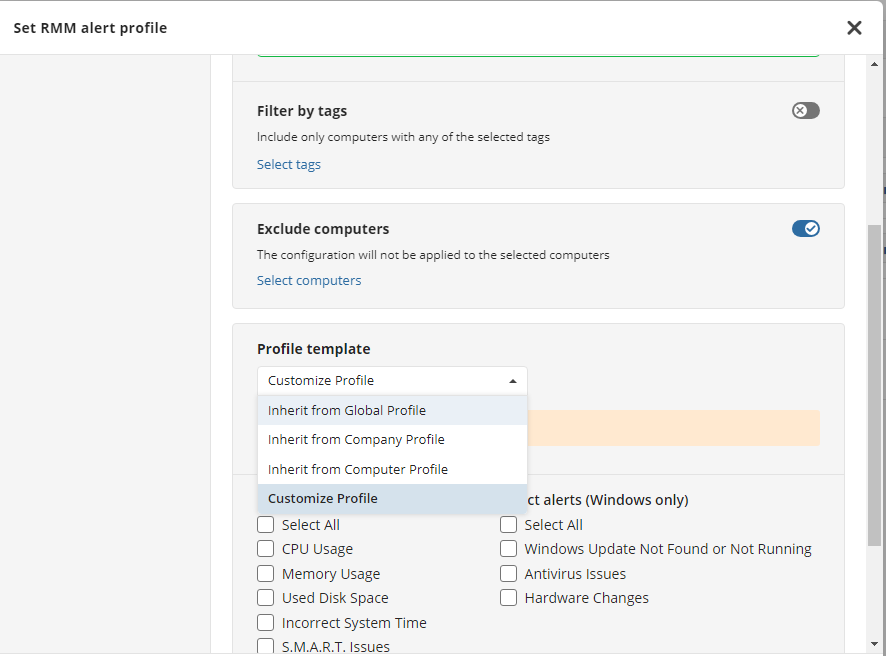
Once all alerts are selected, click Next.
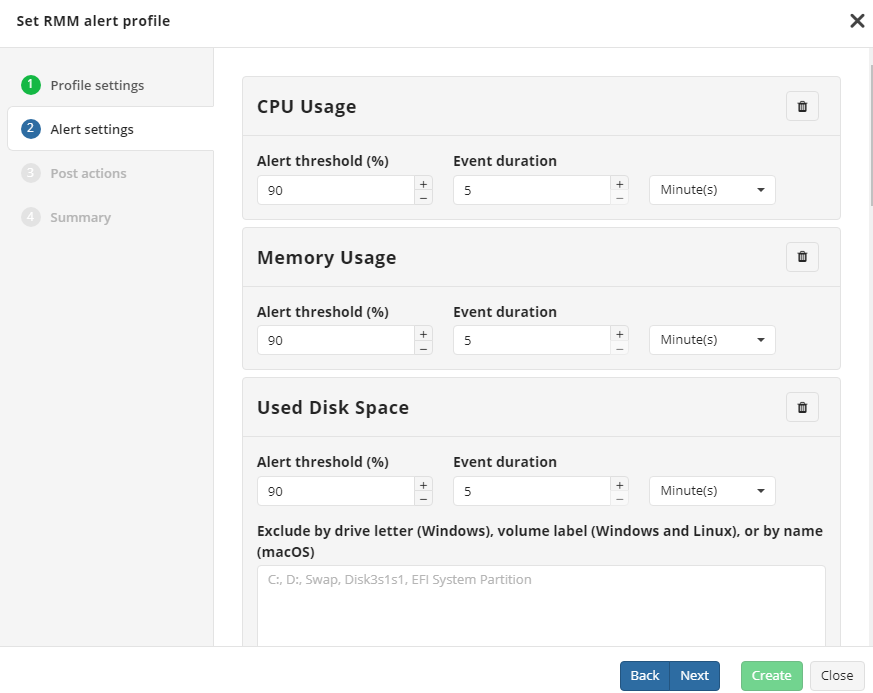
- If the Customize Profile option is selected on the previous step, configure settings for all selected alerts. Click Next.
- Configure the post-actions triggered by RMM Alerts. by default, the Global options for all alerts option is selected.
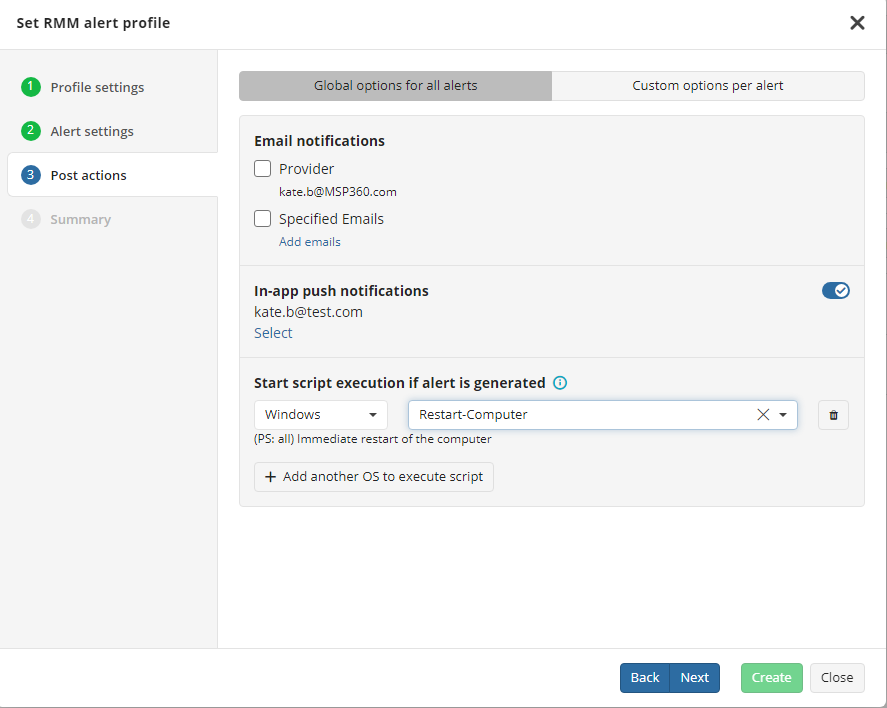
The following options can be configured:
- Email notifications Provider or specified recipients can receive email notifications about selected RMM alerts. These settings can be configured for all alerts or for specific ones. To manage notifications, the Reporting > Notifications permission should be granted as the administrator permission on Organization > Administrators.
- In-app push notifications Specified recipients can receive push notifications about selected RMM alerts. These settings can be configured for all alerts or for specific ones. To manage notifications, the Reporting > Notifications permission should be granted as the administrator permission on Organization > Administrators.
- Environment-based script execution Selected scripts will be executed if the RMM alert is received. You can add more operating systems to select all required scripts from the predefined lists.
- Create RMM ticket (only available for ConnectWise PSA integration).
To configure the post-actions for specific RMM alerts, select the Custom options per alert option. Click Next.
Check the RMM Alert profile summary. If everything is OK, click Create

Created profile appears on the RMM > Alert profiles grid.
Edit RMM Alert Profiles
- Open Management Console
- On RMM > Alert profiles, click the Edit icon next to the profile to edit.

If some conflicts were detected when you are editing any RMM alert profile, you should resolve them. Refer to the Resolve conflicts chapter for details.
Delete RMM Alert Profiles
- Open Management Console
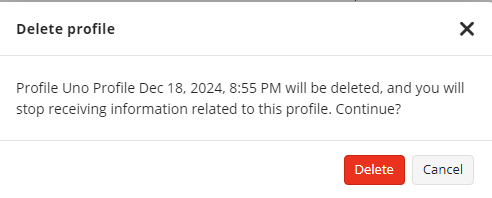
- On RMM > Alert profiles, click the Delete icon next to the profile to delete.

- Confirm the deletion.
