Products: RMM Agent
Article ID: m0314Last Modified: 28-Sep-2024
RMM Service In Management Console
All data collected by RMM Service can be viewed in Management Console along with available remote actions. To access data on remote computers, proceed as follows:
- Open the Management Console.
- On Computers select Remote Management if you use legacy main menu, or open RMM > Computers page in the new main menu.
- Find the RMM column: it contains the information collected by RMM Agents for each computer the Agent installed on.
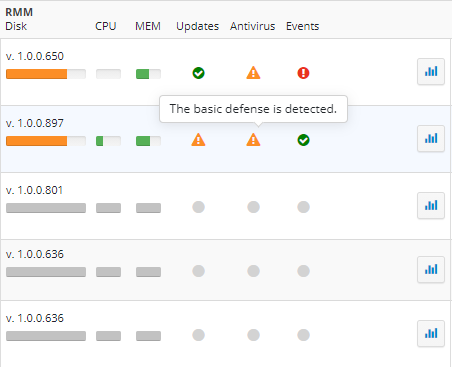
The table below contains the info on warnings and alerts displayed for different components in Management Console.
| Component | Warning Threshold | Alert Threshold | |
|---|---|---|---|
| CPU | 70% | 90% | |
| HDD | 70%️ | 90% | ️ |
| RAM | 70% | 90% | |
| Antivirus | Auto-update:off, or Not updated, or Enabled:off | Antivirus not found or Service not running | |
| Software Update | Available updates found | Service "wuauserv" not found | |
| EventLog | More than 3 errors last day | More than 10 errors within last day/'EventLog' service is not running |
Note that if no RMM Agents are installed, the RMM column is not displayed